GEOGRAPHIC DISTRIBUTION
State-level view
NO DATANo geographic observations for the current selection
LowerHigherClick a state to filter
NATIONAL COMMUNITY WATER SYSTEMS
GEOGRAPHIC DISTRIBUTION
DISTRIBUTION
SCREENING RECORDS
| Rank | Utility record | State | Ownership | Population | Annual charge | Burden | 10y health | Coverage |
|---|
CASE-FINDING WORKSPACE
Separate model-relative anomalies from observed changes over time.
EMMA · MODEL-RELATIVE SCREEN
Residual = observed − cross-validated prediction. Large absolute residuals identify systems furthest from the fitted regression surface. Percentile flags are screening thresholds, not confidence intervals.
| Rank | Utility record | State | Ownership | Health residual | Health extremeness | Charge residual | Charge extremeness |
|---|
INTERIM · COMBINED SUBSET
Positive change means the annual violation average worsened; negative change means it improved. This interim comparison covers PWSIDs available in combinedscaled.xlsx; national all-PWSID coverage is pending an additional dataset.
Points above the diagonal worsened; points below it improved. Extreme values are capped visually at the 99th percentile but retain their true values in the table.
SELECTED RECORD
The selected utility's PWSID, ownership, previous-period average, recent-period average, and change will appear here. This comparison is descriptive and is not evidence of a causal ownership effect.
TREND OUTLIERS
| Rank | Utility record | State | Ownership | Population | 10-year count | Previous annual avg | Recent annual avg | Change | Direction |
|---|
REPORT MODEL EVIDENCE
A focused view of the report's two principal screening outcomes and the samples on which they were estimated.
CORE VALIDATION RESULTS
Average annual charge and 10-year health violations. Combined is excluded until its sample lineage is reconciled.
| Outcome | Layer | Analysis N | Encoded features | CV R² | CV RMSE | CV MAE |
|---|
INTERPRETABILITY EVIDENCE
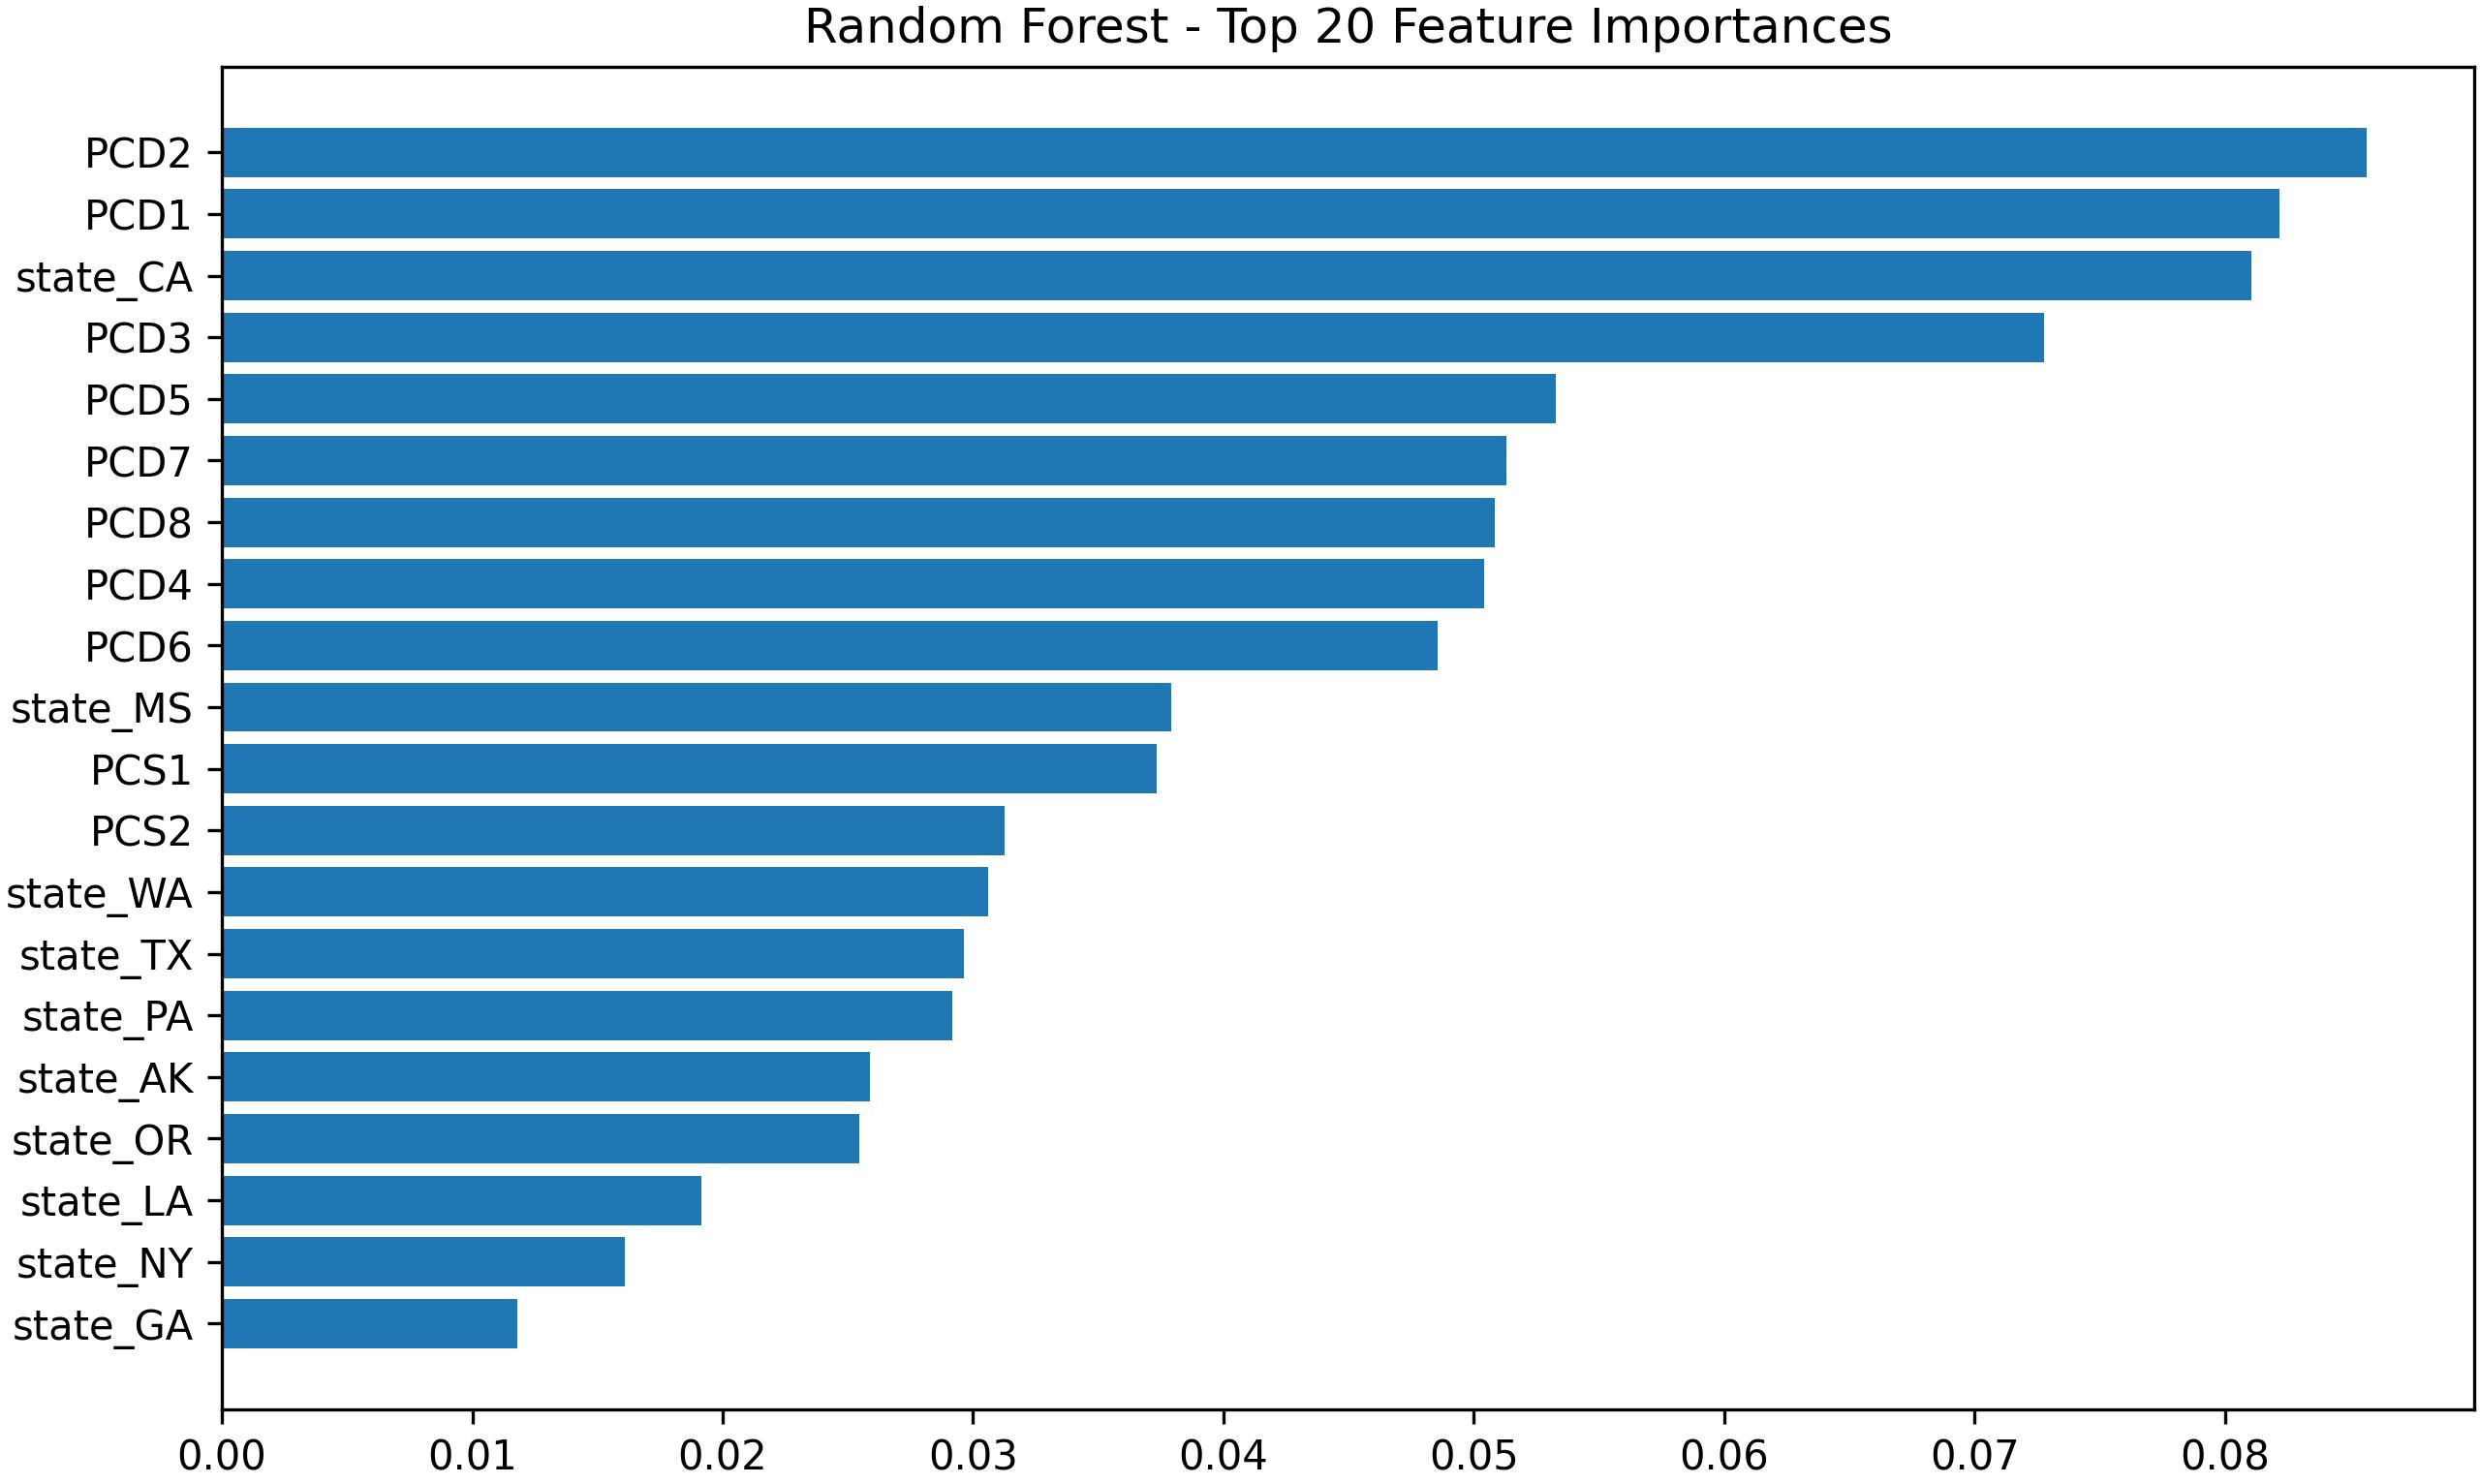
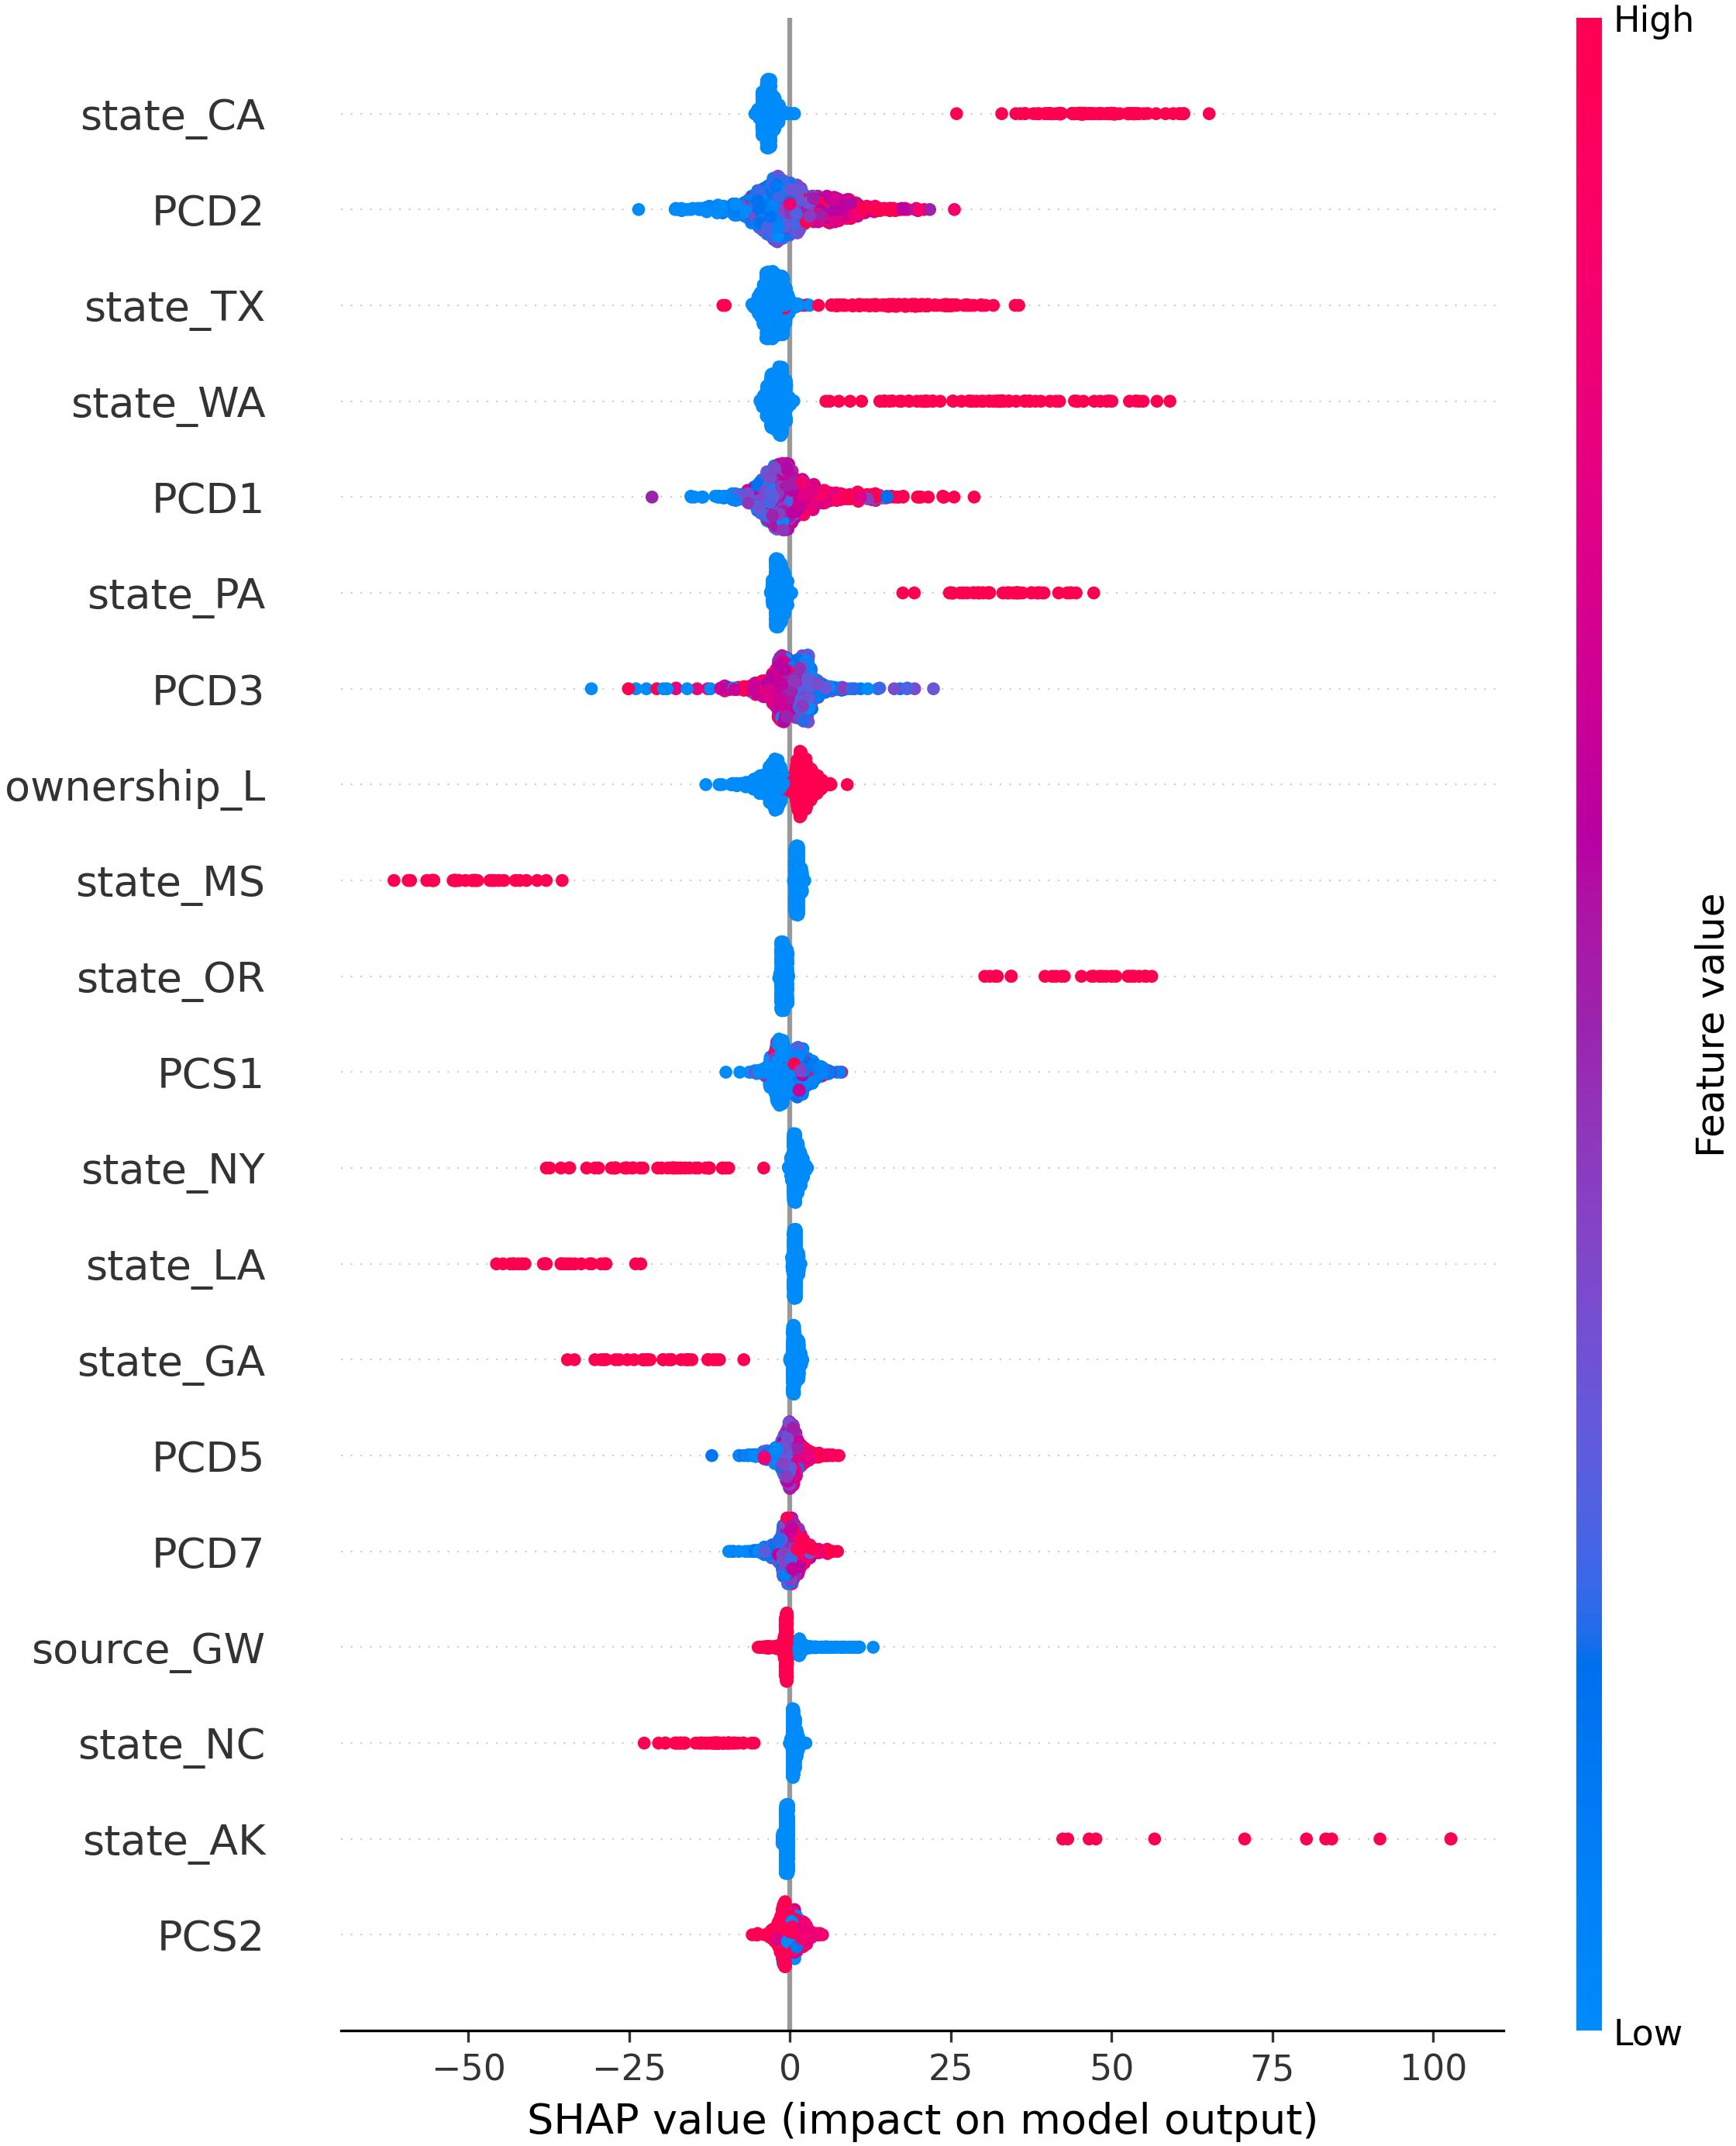
Final report-era random-forest outputs. Importance ranks predictive contribution; SHAP shows direction and dispersion of effects.
SAMPLE LINEAGE AUDIT
| Layer | Reported N | Interpretation | Status |
|---|---|---|---|
| EMMA | 43,531 | National community water-system layer. | Verified |
| Public | 8,007 | Public financial subset used for the core charge and violation models. | Verified |
| Private | 277 | dfpvt model rows; 243 unique PWSIDs after identifier reconciliation. | Verified |
| Combined | 11,628 | Standalone combinedscaled workflow; not the arithmetic union of the current Public and Private samples. | Not reconciled |
Expected Public + Private under the current core samples: 8,284. Reported Combined: 11,628. The extra 3,344 observations must be traced before Combined can support cross-layer comparison.
Additional financial outcomes and legacy Combined outputs retained for provenance.
| Layer | Outcome | Analysis N | Encoded features | Train R² | CV R² | CV RMSE | CV MAE |
|---|
REPRODUCED REPORT OUTPUTS
Performance summaries recovered from the report-era random-forest output workbooks.
VALIDATION SUMMARY
| Layer | Outcome | Observations | Features | Train R² | CV R² | CV RMSE | CV MAE |
|---|
Model performance, feature importance, aggregated SHAP, state-level SHAP, partial dependence, interaction diagnostics, and H-statistics.
Observed and out-of-fold predicted values, residuals, absolute-residual percentiles, flags, and model-version metadata at the PWSID level.
Average annual charge and 10-year health violations, calculated offline and validated against the report-era model metrics.
PROVENANCE AND LIMITATIONS
The state map uses the stored 2018 Census state GeoJSON. No CWS service-area polygons or utility coordinates were found in the project directories, so the map does not imply utility-level location or service boundaries.
Charge burden is annual average water charge divided by median household income. It is a screening ratio, not a formal affordability determination. The reported revenue-to-expense ratio describes available reporting-year records; a value below 1 does not by itself establish financial distress. Missing financial data means “not matched,” not zero.
The primary analytical unit is the community water system identified by PWSID. For 36 Private company/subsidiary records without an EPA identifier, RIK #1–RIK #36 are retained as project-assigned synthetic PWSIDs. They participate in non-spatial summaries and descriptive trends but do not represent mapped service areas or EMMA residual records.